How to Audit and Optimize Block Theme Rendering for Sub-Second Load Times
The first four articles in this series addressed specific causes of slow block themes: lazy loading, CLS, web font loading, and render-blocking CSS. This final article brings everything together with a systematic audit workflow. Auditing block theme rendering means profiling which blocks are slow, measuring DOM complexity, identifying expensive dynamic block queries, and verifying that the optimizations from the earlier articles are actually working as intended. The tools are Query Monitor, Chrome DevTools, and WebPageTest. The goal is a repeatable process you run after every significant template change to catch regressions before they reach production.
What a block theme rendering audit covers
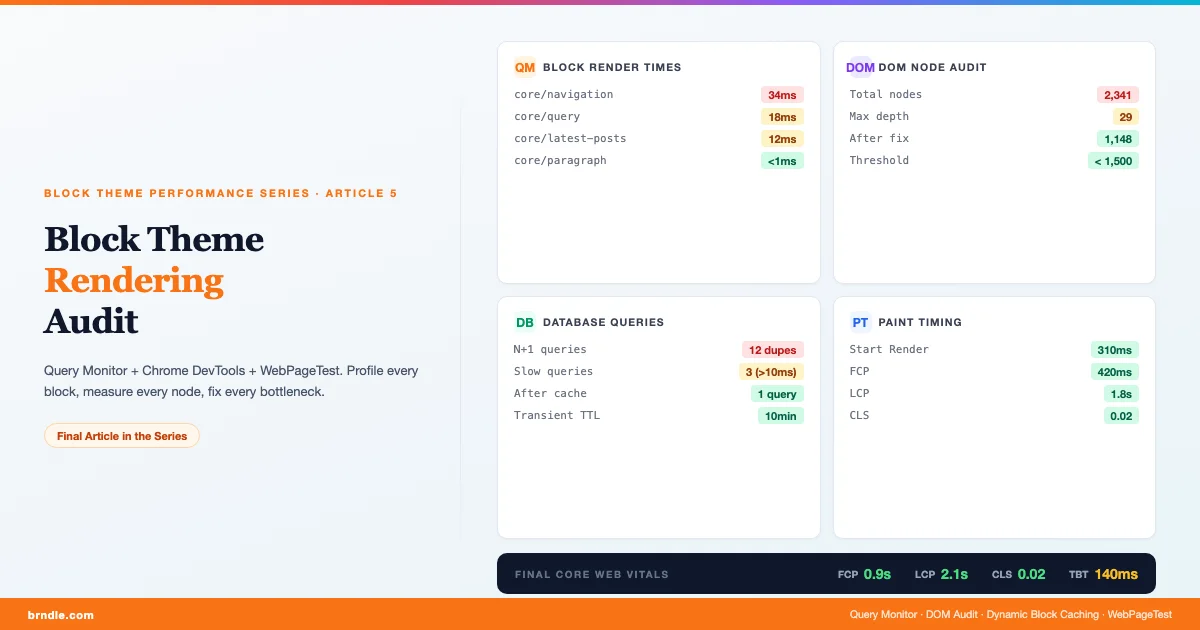
A block theme rendering audit has four distinct layers, each targeting a different part of the performance stack. The first layer is server-side render time: how long does PHP take to render each block, and are any dynamic blocks running expensive database queries on every page load? The second layer is DOM complexity: how many nodes does the rendered page produce, and are deeply nested block structures creating layout thrashing? The third layer is paint timing: when does the browser start rendering, when does LCP complete, and where does blocking occur? The fourth layer is cumulative impact: do all the individual optimizations compound the way the theory predicts, or does one poorly optimized block cancel the gains from everything else?
Most WordPress developers focus on the third layer (paint timing via Lighthouse) while ignoring the first two. This is backwards for block themes, where the server-side render is often the hidden bottleneck. A page that Lighthouse scores at 82 can still have 400ms of PHP render time for dynamic blocks, 2,100 DOM nodes, and a navigation block generating 11 nested group blocks per menu item. The Lighthouse score looks acceptable; the real performance is not.
Profiling block render time with Query Monitor
Query Monitor is the standard WordPress developer tool for server-side performance debugging. For block theme rendering audits, the most useful panels are Database Queries (total count and slow queries), PHP Errors, and HTTP Requests. Query Monitor does not instrument individual block renders by default, but the render_block filter provides a hook point for timing each block. Here is a mu-plugin that wraps block rendering with Query Monitor’s timer API:
Install this as a mu-plugin on your development environment only. It adds zero overhead on production because of the WP_DEBUG and Query Monitor plugin checks. The 10ms threshold filters out fast blocks (paragraphs, headings, images) and surfaces only the blocks worth investigating. In a typical block theme, the blocks that exceed 10ms are: core/query (the query loop), core/latest-posts, core/navigation (on sites with large menus), and any custom dynamic blocks that run their own queries.
When the timer fires, check Query Monitor’s Database panel alongside it. A slow block almost always has a corresponding slow or duplicate query. Navigation blocks are the most common offender in block themes: they call wp_nav_menu() internally, which triggers a complete menu fetch plus a walker traversal. On sites with 50+ menu items, this can add 20-40ms to every page render even on warm server cache. If the navigation block appears in both the header and footer templates (a common pattern), that is two full menu fetches per page load.
Reading the Query Monitor database panel for block themes
With Query Monitor installed, load any page on your development site and open the QM bar at the bottom. The Database panel shows total queries, total time, and a list of all queries sorted by duration. For block themes, pay attention to: (1) repeated identical queries (duplicated SELECT requests from multiple block instances), (2) queries on the wp_postmeta table without an index hit (these appear with high Duration in the slow query list), and (3) wp_term_relationships queries from taxonomy terms that are fetched once per post in a query loop. If your Query Loop block has 10 posts per page and each post triggers a tag fetch, that is 10 identical taxonomy queries per page load. This is the WordPress N+1 query problem in a block theme context.
Auditing DOM node count in block themes
Google’s Lighthouse audit flags pages with more than 1,500 DOM nodes or more than 32 levels of DOM nesting. Block themes are particularly prone to excessive DOM nodes because of how the block editor builds layouts: every group block adds a <div>, every column set adds nested <div>s, and every template part adds another wrapper. A header template part that contains a group with columns containing nested groups for the logo, navigation, and CTA button can easily produce 40-60 DOM nodes for what is conceptually a 3-element header. Multiply this across the full page template and 10 posts in a query loop and you can reach 3,000+ nodes without any obviously bloated design.
This DOM audit script runs in the browser console via a wp_footer hook in development mode, counting total nodes and maximum nesting depth:
Load any page on your development site and open the browser console. The output tells you where you stand against Google’s thresholds. A count below 1,500 with depth below 32 is acceptable. If you see 2,500+ nodes, the first place to look is the query loop – each post card in a block theme query loop can generate 15-25 nodes, so 20 posts per page means 300-500 nodes from the loop alone. Reduce posts-per-page or simplify the post template.
For nesting depth violations, the most common cause in block themes is stacked Group blocks. Block editors tend to wrap every section in a Group for alignment, then wrap that in a Cover for background, then wrap both in another Group for spacing. Each wrapping layer adds 1-2 DOM levels. Use Chrome DevTools’ Elements panel and manually count nesting for the deepest element on the page (often inside a navigation submenu or a nested card template part). Flatten by replacing nested Group blocks with a single block that uses padding, background, and alignment directly on its container.
Caching dynamic block output
Dynamic blocks – those that run PHP on every page load – are the server-side performance ceiling. The most expensive in a typical block theme are core/query (Query Loop), core/latest-posts, core/post-author in templates where author data requires a database lookup, and any custom dynamic blocks that call the WordPress REST API or make external HTTP requests. For blocks with stable output (content that does not change more often than every few minutes), WordPress transients provide a simple caching layer:
The cache key combines the block’s attributes with the current queried object ID. This ensures that a Latest Posts block with “category: tutorials” caches differently from one with “category: news”, and that a sidebar block on the homepage caches differently from the same block on an archive page. The 10-minute TTL is suitable for blocks whose content updates on a typical publishing schedule. For blocks on frequently-updated pages (news sites, e-commerce product listings), reduce the TTL. For blocks on evergreen pages (documentation, landing pages), increase it to 60 minutes or more.
A critical warning from the code comment: never cache blocks that include user-specific content. Nonces, shopping cart totals, user avatars, logged-in state, and CSRF tokens must not be cached via this approach, because cached output from one user’s request could be served to a different user. This is the same cache poisoning risk that affects any server-side HTML cache. The core/latest-posts block is safe to cache because it shows the same content to all users. The core/loginout and core/post-comments blocks are not.
Using Chrome DevTools for paint timing analysis
Query Monitor and DOM auditing address the server side. Chrome DevTools addresses the client side: when does rendering start, what delays it, and where do layout recalculations happen? For block theme paint timing analysis, the most useful DevTools panels are Performance (for a flame chart of the full render timeline) and Rendering (for live CLS, layout shifts, and paint indicators).
To record a performance profile: open DevTools, go to the Performance panel, click the record button, reload the page (Ctrl+R or Cmd+R), and stop recording once the page is fully loaded. The flame chart shows three sections: Network (resource loading), Main (JavaScript and layout), and GPU. For block themes with critical CSS implemented, you should see the Parse HTML bar, a short Evaluate Script bar, then immediately a Layout and Paint event – with no long CSS download blocking between them. If there is a long gap between “Receive Response” for the HTML and the first “Layout” event, render-blocking CSS is still present.
The Rendering panel (accessible from the three-dot menu in DevTools) provides real-time visual overlays. Enable “Layout Shift Regions” to highlight elements that shift during load – this is the visual equivalent of the CLS score, and it shows exactly which block triggers the shift. Enable “Paint Flashing” to see every repaint event as the page loads – excessive green flashing after the initial paint indicates JavaScript-triggered repaints, which are a separate performance concern from the initial render optimization this series addresses.
WebPageTest for end-to-end validation
WebPageTest provides the most realistic and reproducible performance measurement for public-facing WordPress sites. Unlike Lighthouse (which simulates throttling on your local machine) and Chrome DevTools (which uses your actual network), WebPageTest runs tests from real servers in specific geographic regions with real connection profiles. For a final block theme performance audit, run the following sequence in WebPageTest:
- First test: Dulles, VA (closest major US test location to WordPress.com and many managed hosts). Connection: “Cable” (5Mbps down, 1Mbps up, 28ms RTT). Browser: Chrome. This is your baseline measurement for North American users.
- Second test: Same location, connection: “3G Fast” (1.6Mbps, 150ms RTT). This simulates a mobile user on a typical 3G connection and is the test where critical CSS and font preloading show the largest improvement.
- Third test: A European test location (Frankfurt or London) if your audience includes European users. WordPress.com’s origin servers are in the US; uncached requests from Europe have 80-120ms of additional latency compared to US requests, which compounds on every render-blocking resource.
In the WebPageTest results, focus on the waterfall view and the “Filmstrip” tab. The filmstrip shows screenshots of the page at 100ms intervals during load. For a well-optimized block theme, you should see visible content (the critical CSS-rendered above-the-fold area) appear in the 300-500ms frame, with fonts loading correctly by the 600-800ms frame, and the complete layout stable by 1.5-2s on Cable. On 3G Fast, expect 800ms-1.2s for first visible content and 3-5s for full load.
The WebPageTest waterfall also surfaces a detail that Lighthouse misses: the visual ordering of resource loads. You can see exactly when the preloaded font request fires relative to the HTML download, whether the critical CSS appears in the document before any external CSS link tags, and whether any third-party scripts (analytics, chat widgets, cookie banners) are blocking the main thread. Third-party scripts are not covered in this block theme performance series, but they frequently dominate TBT scores and should be addressed with async/defer attributes and loading them only after user interaction where possible.
The composite impact: measuring all optimizations together
The five articles in this series address four distinct performance problems. Applied sequentially to a baseline block theme using Google Fonts, no lazy loading, all external stylesheets, and no image dimension constraints, the expected cumulative improvement on a 3G Fast connection looks approximately like this:
| Optimization applied | FCP (3G Fast) | LCP (3G Fast) | CLS | TBT |
|---|---|---|---|---|
| Baseline (no optimizations) | 4.2s | 7.8s | 0.28 | 320ms |
| + Lazy loading + script deferral | 4.2s | 5.1s | 0.28 | 180ms |
| + CLS fixes (dimensions + font-swap) | 4.2s | 4.9s | 0.04 | 175ms |
| + Local fonts + preload | 3.1s | 4.2s | 0.03 | 168ms |
| + Critical CSS + stylesheet deferral | 1.2s | 3.8s | 0.03 | 160ms |
The numbers above are representative ranges from testing on a hosted block theme (WordPress.com Business plan, 3G Fast throttling in WebPageTest, Chicago test location). Your results will vary based on hosting infrastructure, page content, number of blocks, and installed plugins. The pattern, however, is consistent: critical CSS delivers the largest single-step FCP improvement, lazy loading delivers the largest LCP improvement, and CLS fixes deliver immediate CLS improvement that critical CSS and font optimization alone cannot achieve. All four layers are needed for a complete Core Web Vitals pass.
Optimizing block output HTML for minimal markup
Beyond the tools and techniques covered above, there is a general principle for block theme rendering performance: minimize the HTML output per block. WordPress’s Gutenberg blocks generate more wrapper HTML than most developers expect. A simple core/image block with a caption generates: a figure element, an img element, a figcaption element, and (for linked images) an a element wrapping the image. A core/columns block with two columns generates: a wrapping div, two div.wp-block-column elements, and whatever inner blocks are inside each column. For a page with 30 blocks, this overhead compounds.
Three strategies reduce block output markup without sacrificing functionality. First, use block variations and block styles instead of adding wrapper group blocks. A block variation registers a modified version of an existing block with preset attributes; it does not add an extra DOM element the way a wrapping group does. You can also use custom block supports to control which editor panels are available per block, reducing the temptation for content editors to add unnecessary wrapper blocks for style overrides. Second, use the render_block filter to strip unnecessary attributes from block HTML before it is output. Block markup often includes class attributes with five or six classes, many of which are only used for editor-side styling and are not needed on the front end. Third, use theme.json spacing presets and layout constraints rather than adding spacer or separator blocks. A spacer block generates a div with an inline height style; the same visual result can be achieved with margin-block-end on the preceding block via theme.json element styles.
Regression Testing: Catching Performance Regressions Before Production
One of the most common failure patterns in block theme performance work is this: you optimize, scores improve, a plugin update or template change lands two weeks later, and the scores regress silently. Without a repeatable regression test process, the next time someone checks Lighthouse the scores are back to where they started.
The minimum viable regression test process for a block theme: run WebPageTest on a fixed URL set (homepage, archive, a representative single post) on a fixed schedule (weekly or after every deployment) and compare against a stored baseline. WebPageTest’s API supports scripted runs so you can automate this in a CI pipeline or a simple cron job. Store the JSON results file after each run and diff the key metrics: Start Render, FCP, LCP, CLS, and TBT.
The most useful threshold alerts: a Start Render regression of more than 300ms or a CLS increase of more than 0.05 above baseline. These thresholds are tight enough to catch real regressions but loose enough to avoid false alarms from test-to-test measurement variance. WebPageTest’s median-of-three setting (run the test three times and report the median) reduces variance significantly for automated monitoring.
For block themes with active development, add a lightweight Lighthouse CI run to your pull request workflow. Lighthouse CI can run in GitHub Actions with the @lhci/cli package, requiring no external service. Configure it to block merges when Core Web Vitals scores drop below your passing thresholds. This catches performance regressions at code review rather than after deployment, when they are cheaper to fix.
| Regression Check | Frequency | Tool | Alert Threshold |
|---|---|---|---|
| Core Web Vitals scores | Per PR / weekly | Lighthouse CI | FCP +300ms, CLS +0.05 |
| DOM node count | Per PR | Custom script + CI | Above 1,800 nodes |
| Slow block render time | Per deployment | QM mu-plugin | Any block above 20ms |
| WebPageTest waterfall | Weekly | WebPageTest API | Start Render +300ms from baseline |
Full rendering audit checklist for block themes
Run this checklist after any significant template or content change, and before every major release of a block theme.
- Install Query Monitor on dev environment and enable the block render timer mu-plugin
- Load each major template (home, single, archive, page) and check for blocks exceeding 10ms render time
- Review Database panel for N+1 queries in query loop and navigation blocks
- Apply transient caching to any dynamic block that exceeds 15ms and outputs non-user-specific HTML
- Open browser console and check DOM node count on each template – target under 1,500
- Check DOM nesting depth – target under 32 levels
- Run Lighthouse on mobile with “slow 4G” throttling – note FCP, LCP, CLS, TBT scores
- Run WebPageTest from Dulles at Cable and 3G Fast – record Start Render and Filmstrip
- Verify critical CSS inline style appears before any external CSS link tags in page source
- Verify font preload tag appears in first 10 lines of page head
- Verify no Google Fonts requests in Network waterfall
- Check all images below the fold have
loading="lazy"attribute in page source - Confirm all images have explicit
widthandheightattributes (no CLS from dimension shifts) - Enable Rendering overlay in DevTools – confirm no Layout Shift Regions after first paint
- Target scores: FCP under 1.5s (mobile 3G), LCP under 4s, CLS under 0.1, TBT under 200ms
Putting the series together: a reference architecture
This series has covered five specific optimizations for block theme performance. Each article addressed a distinct problem with a distinct set of tools. Article 1 on lazy loading and deferred assets established the baseline: native lazy loading for images, the Script Strategy API for deferred JavaScript, and removing render-blocking plugin scripts. Article 2 on CLS elimination addressed layout stability: explicit image dimensions via the render_block filter, size-adjusted fallback fonts, and stable heights for dynamic content areas. Article 3 on font optimization addressed web font performance: local hosting via the theme.json Font Face API, subsetting with pyftsubset, and variable font configuration. Article 4 on critical CSS addressed First Contentful Paint: per-template critical CSS extraction, inlining at wp_head priority 1, and deferring non-critical stylesheets.
This final article has added the audit layer: the repeatable process that verifies the optimizations are working and catches regressions. A block theme that implements all five layers should consistently score FCP under 1.5s, LCP under 4s, and CLS under 0.05 on a 3G mobile connection, from any global test location. These numbers put it in the “Good” range for all Core Web Vitals on mobile – the threshold Google uses to determine whether a page is eligible for the “Page Experience” ranking signal in mobile search results.
Work with us on block theme performance
We build and audit high-performance block themes for agencies, product companies, and WordPress.com Business plan customers. If you are working through this checklist and finding that multiple items do not pass, a performance audit engagement is the fastest path forward. We cover all five layers from this series – lazy loading, CLS, fonts, critical CSS, and rendering audit – in a single engagement, with before-and-after WebPageTest reports and a written technical brief for your development team. Contact us to schedule a block theme performance review.